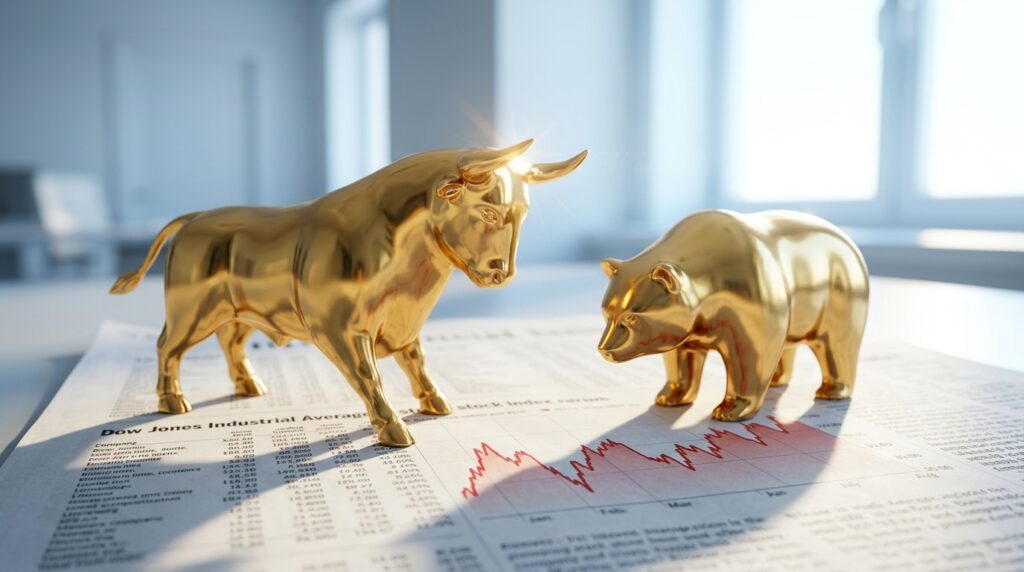
When financial news anchors say “the market was up 500 points today,” they’re almost always talking about one index: the Dow Jones Industrial Average. It’s remarkable when you think about it. The U.S. stock market contains thousands of publicly traded companies, yet a 130-year-old index tracking just 30 of them remains the world’s most quoted market barometer.
In this guide, you’ll find the Dow Jones explained from the ground up, its history, its unusual calculation method, the stocks inside it in 2026, and where to track it in real time. If you’re building a broader understanding of American markets, start with our complete US stock indices guide, then come back here for the deep dive.
What Is the Dow Jones Industrial Average?
The Dow Jones Industrial Average (DJIA), usually shortened to “the Dow”, is a stock market index that tracks 30 large, established, blue-chip American companies. Created in 1896 by Charles Dow, co-founder of Dow Jones & Company and The Wall Street Journal, it’s the second-oldest U.S. market index still in operation.
The Dow is maintained today by S&P Dow Jones Indices, whose index committee selects companies based on reputation, sustained growth, investor interest, and sector representation. There’s no rigid formula for inclusion, it’s a judgment call, which is part of why Dow membership is considered a badge of corporate prestige.
Despite the word “Industrial” in its name, the modern Dow has little to do with smokestacks. Today’s roster spans technology, healthcare, financial services, consumer goods, and energy, a snapshot of the companies that define the American economy at any given moment.
History of the Dow, From 1896 to Today
Charles Dow launched the index on May 26, 1896, with just 12 companies, railroads’ industrial cousins like American Cotton Oil, U.S. Leather, and General Electric. The index expanded to 20 stocks in 1916 and reached its current size of 30 stocks in 1928, where it has stayed ever since.
The milestones tell the story of American capitalism:
- 1929–1932: The Dow lost roughly 89% of its value in the Great Depression crash, not recovering its 1929 peak until 1954.
- 1972: First close above 1,000.
- 1987: Black Monday wiped out 22.6% in a single session, still the worst one-day percentage drop ever.
- 1999: The dot-com boom carried the Dow past 10,000.
- 2020: COVID-19 triggered a 37% crash in five weeks, followed by one of the fastest recoveries in history.
- 2024: The index broke 40,000 for the first time in May.
- 2026: <cite index=”1-1″>On February 6, 2026, the Dow crossed 50,000 for the first time</cite>, and it hasn’t looked back. <cite index=”10-1″>In the first six months of 2026, the Dow climbed 8.9%, its best first-half performance since 2021</cite>, and as of early July 2026 it trades near the 52,900 level after setting fresh record highs.
No original member remains. General Electric, the last survivor of the 1896 lineup, was removed in 2018, proof that even the bluest of blue chips can fade.
How the Dow Jones Is Calculated (Price-Weighting Explained)
Here’s where the Dow gets genuinely weird, and why understanding its math matters.
Most major indices, like the S&P 500 and Nasdaq Composite, are market-cap weighted: the bigger the company, the bigger its influence. The Dow is price-weighted: the higher a stock’s share price, the more it moves the index, regardless of company size.
The formula is simple:
DJIA = Sum of all 30 stock prices ÷ Dow Divisor
The Dow Divisor is a constantly adjusted number (currently well below 1) that keeps the index consistent through stock splits, spinoffs, and component changes. Because the divisor is less than 1, a $1 move in any single Dow stock shifts the index by roughly 6–7 points.
The distortion this creates is real. <cite index=”1-1″>As of March 2025, Goldman Sachs was the largest component of the index despite a market capitalization of roughly $167 billion, while Apple, worth about $3.3 trillion at the time, fell outside the top 10 components</cite> simply because its share price was lower. A high-priced stock like Caterpillar, <cite index=”7-1″>which gained over 145% in the year through mid-2026</cite>, can swing the Dow far more than a trillion-dollar giant trading at $200 per share.
Critics call this methodology outdated. Defenders note it has worked as a market gauge for 130 years. Both are right.
The 30 Dow Stocks in 2026
The Dow’s roster keeps evolving to reflect the modern economy. Recent changes show a clear pivot toward technology:
- February 2024: Amazon replaced Walgreens Boots Alliance.
- November 2024: Nvidia replaced Intel, and Sherwin-Williams replaced Dow Inc.
- <cite index=”1-1″>June 29, 2026: Alphabet replaced Verizon Communications</cite>, bringing Google’s parent company into the index just days ago.
With Alphabet’s arrival, the Dow now houses most of America’s mega-cap tech names: Apple, Microsoft, Amazon, Nvidia, and Alphabet sit alongside stalwarts like JPMorgan Chase, Johnson & Johnson, Coca-Cola, McDonald’s, Visa, Walmart, Home Depot, Boeing, Chevron, and Caterpillar. <cite index=”7-1″>The largest components by market cap are now Nvidia (~$4.7 trillion), Apple (~$4.5 trillion), and Alphabet (~$4.3 trillion)</cite>, though remember, market cap doesn’t determine their index weight; share price does.
Dow Jones vs. S&P 500 vs. Nasdaq
The three headline U.S. indices measure very different things:
| Feature | Dow Jones | S&P 500 | Nasdaq Composite |
| Stocks | 30 | ~500 | 3,000+ |
| Weighting | Price | Market cap | Market cap |
| Founded | 1896 | 1957 | 1971 |
| Character | Blue-chip barometer | Broad-market benchmark | Tech-heavy growth gauge |
The S&P 500 is what professionals actually benchmark against, read our S&P 500 index guide for the full breakdown. The Nasdaq Composite skews heavily toward technology and growth stocks, which is why it often diverges sharply from the Dow; our Nasdaq Composite explained guide covers that dynamic in detail.
2026 has been a textbook example of divergence. While AI and semiconductor stocks pulled the Nasdaq into volatile territory mid-year, <cite index=”10-1″>the “boring” blue-chip names of the Dow attracted steady inflows from investors taking profits in tech, what strategists dubbed the “Great Rotation”</cite>. When the three indices move differently, that gap itself is market information.
Sector Breakdown
The modern Dow spans roughly nine sectors. Financials (JPMorgan, Goldman Sachs, American Express, Visa, Travelers) and technology (Apple, Microsoft, Nvidia, Salesforce, IBM, Cisco, Alphabet) carry the heaviest representation. Healthcare (UnitedHealth, Johnson & Johnson, Merck, Amgen), consumer names (Walmart, McDonald’s, Coca-Cola, Nike, Procter & Gamble, Home Depot, Disney), and industrials (Caterpillar, Boeing, Honeywell, 3M) round out the core, with Chevron flying the energy flag and Sherwin-Williams representing materials.
Notably absent: utilities and transportation stocks, which have their own dedicated Dow Jones averages (the Utility Average and the Transportation Average, the original 1884 index).
Major Dow Crashes & Rallies
The Dow’s long history makes it the best record we have of market extremes:
- Worst single day (points): March 16, 2020, down 2,997 points during the COVID panic.
- Worst single day (percentage): October 19, 1987, down 22.6% on Black Monday.
- Longest bear market: 1929–1932, an 89% peak-to-trough collapse.
- Fastest 10,000-point gains: The runs from 40,000 (May 2024) to 50,000 (February 2026) took barely 21 months, the quickest such milestone leap in the index’s history, powered by AI-driven earnings growth and a resilient U.S. economy.
The lesson repeated across 130 years: crashes are violent but temporary; the long-term trajectory has always recovered and pushed higher.
Where to Track the Dow Jones Live
You have plenty of free options for real-time or near-real-time Dow data:
- Google Finance / Yahoo Finance: Fastest way to check the level, chart, and daily movers (ticker: ^DJI).
- CNBC & Bloomberg: Best for live commentary connecting Dow moves to breaking news.
- TradingView: The go-to for chartists, with advanced technical tools on the DJI symbol.
- FintechZoom: The fintechzoom.com dow page has become a popular aggregator for retail investors, combining live DJIA quotes with news summaries, historical charts, and component performance in a single dashboard. It’s a convenient one-stop view, though for order execution or official data you should always cross-check with your broker or S&P Dow Jones Indices directly.
- Broker apps: Fidelity, Schwab, Interactive Brokers, and similar platforms stream live index data to account holders.
How to Invest in the Dow
You can’t buy an index directly, but you can buy products that replicate it:
- ETFs: The SPDR Dow Jones Industrial Average ETF (DIA, nicknamed “the Diamonds”) tracks the Dow at roughly 1/100th of its level and is the simplest route for most investors.
- Index mutual funds: Several fund families offer Dow-tracking mutual funds for retirement accounts.
- Futures and options: Dow futures (YM) and DJX options suit active traders hedging or speculating on index moves.
- Buying components directly: Some investors hand-pick individual Dow stocks, you get the blue chips without the price-weighting quirks.
Because the Dow holds only 30 stocks, it’s more concentrated than the S&P 500. Many advisors treat DIA as a satellite holding rather than a core position. As always, this is educational information, not investment advice, assess your own goals and risk tolerance first.
FAQs About the Dow Jones
What does “Dow Jones explained” simply mean? The Dow is an index of 30 major U.S. companies whose combined share prices, divided by a special divisor, produce a single number representing blue-chip market performance.
Why only 30 stocks? Tradition and design. The index committee believes 30 carefully chosen leaders can represent the broad economy, and 130 years of correlation with wider markets largely supports that.
Is the Dow at an all-time high in 2026? Yes. After crossing 50,000 in February 2026, the index set repeated records through mid-year, trading near 52,900 in early July 2026.
Which company was most recently added to the Dow? Alphabet (Google’s parent), which replaced Verizon on June 29, 2026.
Is the Dow or the S&P 500 a better market measure? The S&P 500 is broader and more representative; the Dow is older, more famous, and easier to follow. Most professionals use the S&P 500 as their primary benchmark.
Is fintechzoom.com dow data official? No, FintechZoom aggregates market data for convenience. Official index data comes from S&P Dow Jones Indices; always verify figures before making decisions.